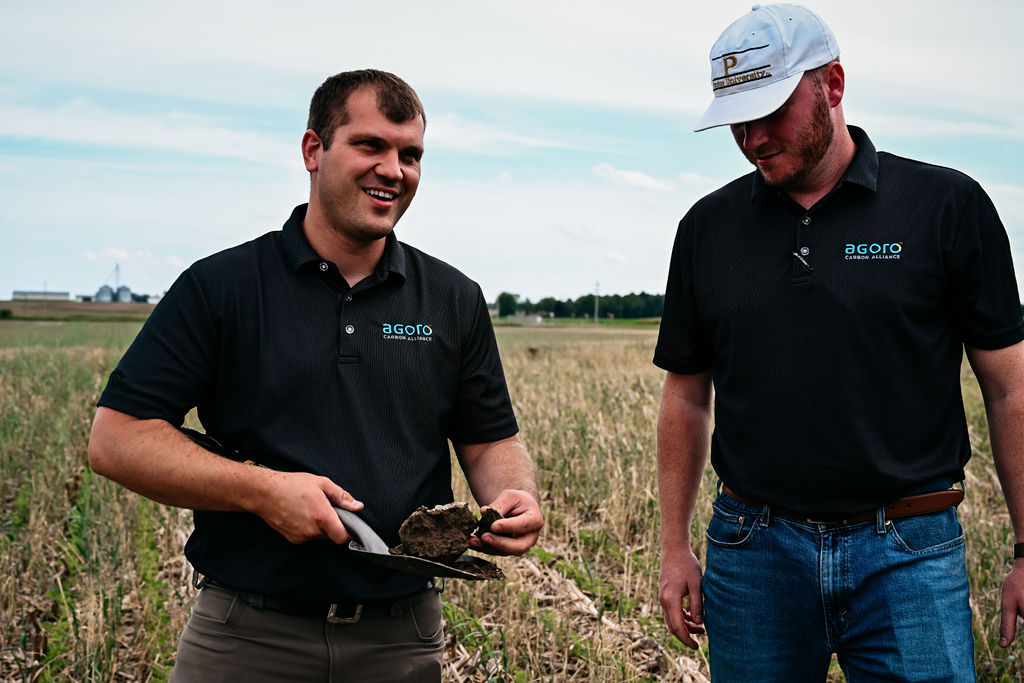
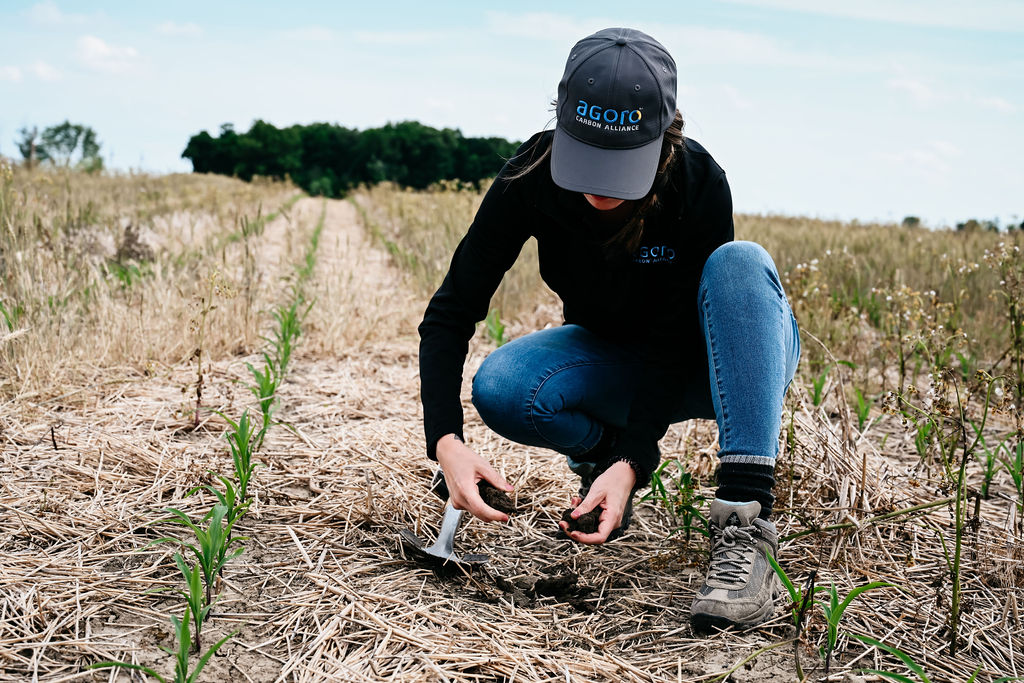
In a previous Ag Carbon Knowledge Hub article, entitled “Trust in the Progress,” we described how our third-party vendors physically collect soil samples to monitor soil organic carbon (SOC) stock changes on our grower farm and ranch fields. This article focuses on how we assign individual sampling locations to each field. Since it is not economical to collect and analyze soil samples from the entire field, our goal is to develop a soil sampling scheme with the appropriate sample number and locations to accurately represent SOC values for a given field. This ensures that when the soil samples are analyzed in the lab, the results accurately represent the actual SOC stocks for a given field. The goal of our sampling design process is to measure SOC stock within a 10% margin of error.
To accomplish this goal, we use an array of geospatial data sources (data having latitude and longitude coordinates) and geospatial software tools that can process this geospatial data to develop what is called a stratified random sampling design. This design represents a sampling method that separates the variable soil conditions that exist in most fields into smaller areas or zones known as strata. Each strata represents field areas or zones that have similar characteristics (i.e. topography, soil properties, vegetative cover, etc.), and therefore likely to have more similar SOC levels as compared to the SOC content across the entire field.
Agoro Carbon’s 5-Step Soil Sampling Design Process
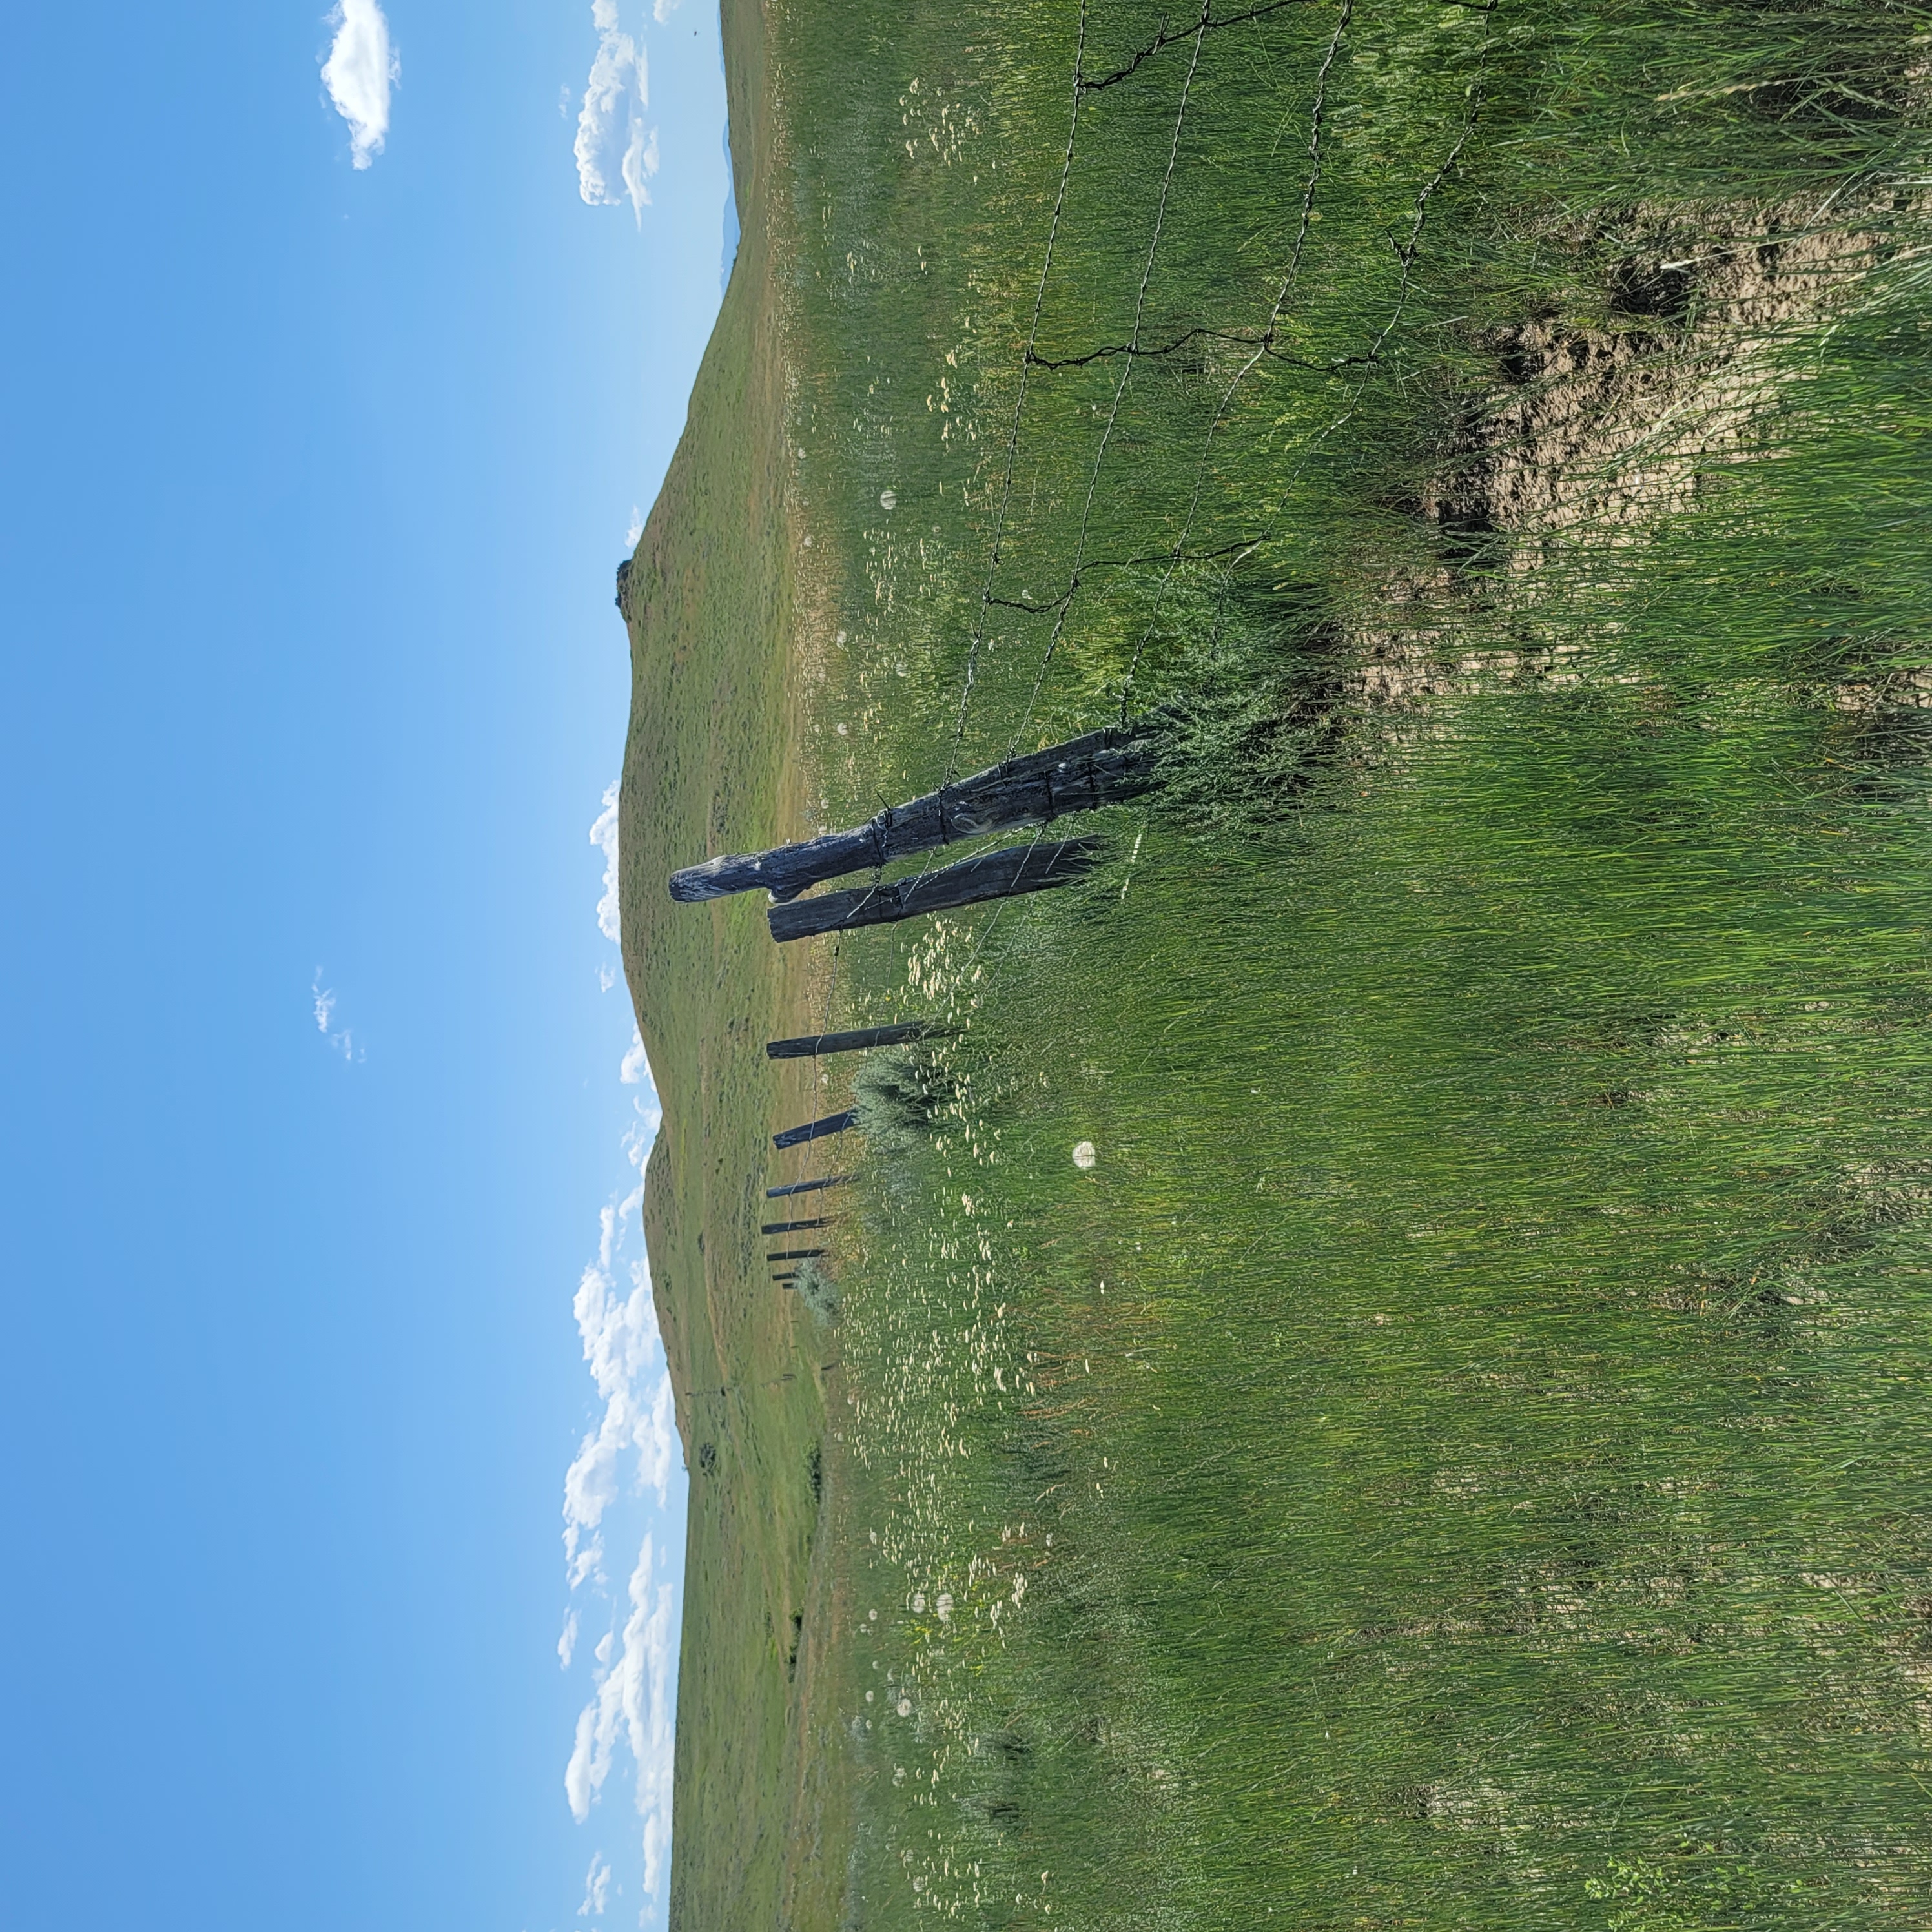
Our sampling design team utilizes a 5 step process to create these strata. The first step is conducting a land cover classification of the grower’s field with remote sensing technology. This discussion is focused on land cover classification, as it is one of the most important steps in the process. Land cover type plays an important role in where we assign sampling locations, as it ensures that we sample land area only where vegetation exists, with potential to sequester SOC, while avoiding areas that have no vegetation or cannot be physically sampled (i.e, barren land, bodies of water, roads, wetlands, buildings, etc.).
Agoro Carbon’s Methods for Land Cover Classification
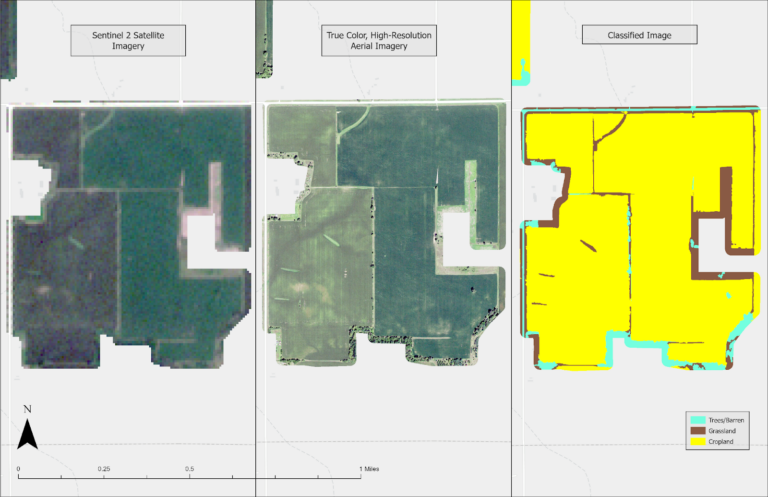
Our land cover classification process uses publicly available satellite (Sentinel 2) and aerial imagery (USDA National Agriculture Imagery Program (NAIP). Sentinel images have a larger pixel size of 32 ft compared to NAIP images of less than 3ft. Why is this important? Pixel size determines the resolution or detail that can be identified in a given image. Think of digital TVs – the smaller and more pixels you have, the higher the quality image. While satellite imagery is able to view larger regions than aerial images, it is unable to distinguish the fine spatial details that aerial imagery can (see Fig. 1). The NAIP imagery we are using is acquired every two years for each state, ensuring that as growers enroll in our program we are using the most up-to-date imagery. Using both imagery sources allows us to evaluate large areas more efficiently, while at the same time discerning fine field detail. Other data sources that we use consist of property boundaries, historical planting/grazing information, and other information provided by our growers so that we ensure that soil samples are collected on your property. We also use high power computers, machine learning, and imagery processing methods to quickly classify large farms and ranches.
We use Geographic Information System (GIS) processing software packages to conduct our land cover classification steps that allow us to view, store, and manipulate large geospatial data sets, like remotely sensed imagery, very efficiently. Figure 1 is an illustration of how we use different imagery sources along with the GIS tools to classify the landscape for one of our grower fields. The Sentinel image (left) allows us to efficiently view large geographical areas, while the NAIP aerial photographs (center) provide greater image detail. By using both image sources along with GIS tools we can group fields into different land cover classifications. For example, based on the classification for this field, our soil samples would only be assigned to the cropland and grassland areas that have potential to sequester SOC, while we would avoid sampling areas with trees and barren terrain that either can’t be sampled or won’t sequester SOC.
Why Agoro Carbon’s Sample Design Strategy is Industries Best
As was mentioned at the outset of this discussion, our goal in designing soil sampling schemes for every field enrolled in our carbon credit program is to measure SOC stocks within a 10% margin of error. To accomplish this goal we are using best in class land cover classification procedures. These methods include not only using satellite imagery, which is the industry standard, but we also use high resolution aerial imagery (unique to Agoro Carbon) to help stratify fields into different land cover classifications. This additional step is very critical as it allows us to delineate fields into strata with very fine spatial detail, which cannot be done using publicly available satellite imagery alone. This enables us to avoid sampling areas that can’t be accessed (ie. tree lines and water bodies) or have no ability to sequester carbon such as barren land. Likewise, it is also important to separate cropland and grassland areas into different strata, because of their difference in ability to sequester SOC. Stay tuned for the next article in this series as we describe how our land cover classification step is used along with other data layers and software tools to stratify each field and assign sample locations with each of the strata.